
It may have started off sounding very complicated when you first heard it. Now you probably see it written all over the place – in newspaper headlines, finance shows. Even in a conversation with your buddy who wonders how the stock market may be breaking records yet his grocery bill doesn’t stop going up. This is called the “K-Shaped” economy, and after you learn the meaning behind it. It will no longer seem so much like an economic term but rather an issue that you yourself might be experiencing.
This is not something to just throw out there and move on from. Whether you’re on the top or bottom part of the “K”, this topic will affect your financial life differently. So let’s figure out what it is, why it was developed, and most importantly, how it affects your own money situation.
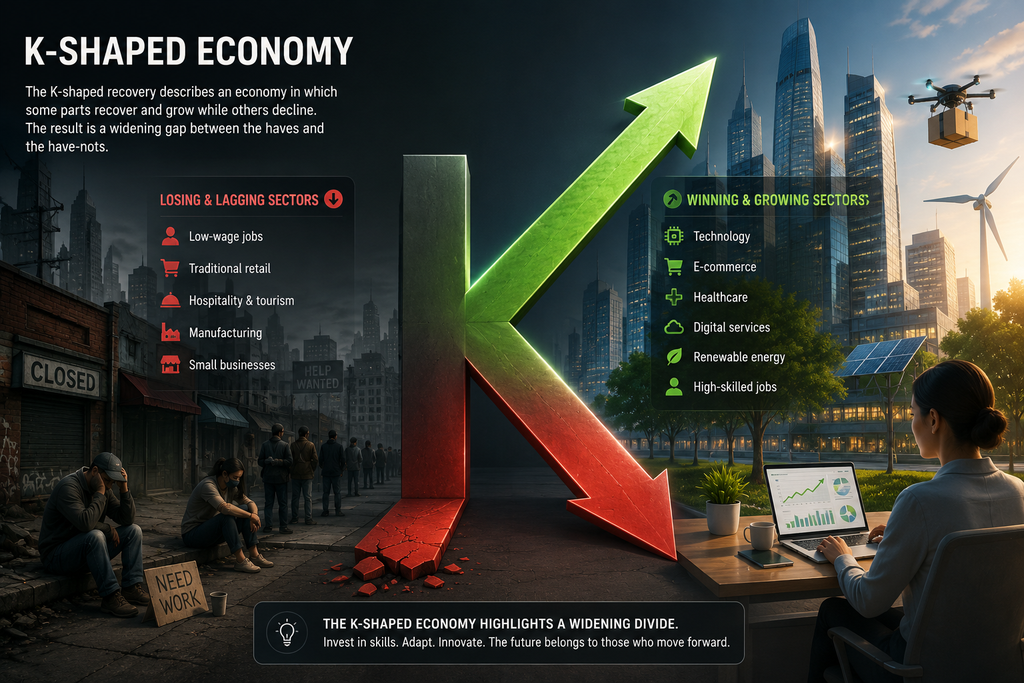
What Does a K-Shaped Economy Actually Mean?
Essentially, a K-shaped economy refers to a scenario where different sections of society or the economy itself are going in opposite directions at the same time. One section rises while the other declines. This is different from what happens in a normal economy, where there is an overall rise or fall in the economy.
Looking at the letter “K” itself, we can see how the economy branches out in two separate directions following a common start. It is normally an economic crisis, such as a recession. On one side of the “K,” we have rising individuals, companies, or industries who are doing well with higher income levels. On the other hand, we have the other section of the economy declining, as reflected by lower income and reduced investments. Even though these two sections belong to the same economy, they experience completely different things as they move through their daily lives.
Why Is It Called a K-Shaped Economy?
The name of the phenomenon arises right from its very appearance on the graph. Unlike the conventional recovery graph, where you have one line rising or falling. Here you see two lines diverging from each other from a common point. Much like a pair of diagonals of the letter “K.”
The reason why the letter “K” was chosen to describe this paradox lies in its ability to depict the complexity of the situation in question – the fact that, at any given time. The state of the economy may be both good and bad, depending on whom you ask. Indeed, while the overall figures for GDP or the stock market may look good. A lot of people still may be losing out, because those who are at the top are spending and investing enough to keep statistics positive.
Who Coined the Term K-Shaped Economy?
Its roots lie in the early days of the coronavirus pandemic. The term “K recovery” was coined by an anonymous social media user, calling himself “Ivan the K,”. He suggested the gloomy prospect of some sectors of pre-pandemic life recovering while others simply vanishing from existence.
However, the economist usually recognized as the one who gave the term its popularity is Peter Atwater. A part-time professor at William & Mary University. He spotted the emerging divide in real time between white-collar and blue-collar workers during the pandemic. It included those people who continued working from home with the same level of earnings as before the crisis. And those who had to go to work, risking their lives. In 2020, Atwater began to publish his articles on this theme, and even though Ivan the K deserves credit for the initial idea. He was the one who developed it.
History
At first, the term was used to refer to a unique combination of circumstances caused by lockdowns, remote working, and the bifurcation. But even when the actual pandemic receded into memory, the basic mechanism underlying this phenomenon. Increasing the wealth of asset owners and leaving wage-earners behind remained the same, repeating itself every year. Irrespective of changes in inflation rate, interest rate policy, and market performance.
By the middle of the 2020s, the term had evolved beyond the pandemic, becoming a shorthand way to talk. It is about the divide between the various income classes within the same economy in their experiences.
What the Data Actually Shows
If you ever came across the chart representing a K-shaped economy. There is a good chance that such a chart represents income and spending at different points in different income groups. And the trends are rather clear-cut in most cases, regardless of the data source used.
One of the examples of this phenomenon is wealth inequality. The latest Federal Reserve data shows how much of a share in the national wealth belongs to the wealthiest 1%. It currently has three times the share it did in the 1990s, whereas the share of households has decreased. There is also a spending trend. Numerous studies carried out by reputable banks and research firms reveal that the highest earners contribute nearly half of all consumer spending in the country.
And finally, there is the data on retail spending. It is not a coincidence that luxury spending has been outpacing regular spending in the recent K-shaped economy charts. The former is driven by those who can afford it, whereas the latter is driven by people who spend their money on essentials.
Are We in a K-Shaped Economy Right Now
Indeed, this is one of the most controversial issues in economics today. The answer to this question, however, depends on whom you ask and on what particular statistic he refers to. Many economic experts and scholars claim that this is true, and statistics confirm this conclusion. Several recent studies have revealed that the top 10% income group has taken control of consumer spending. The bottom 50%, on the contrary, have had to struggle with shrinking incomes, rising debts, and slow wage growth. Some of the financial institutions have mentioned that the K-shaped economic recovery is still “alive and well”.
However, there is definitely evidence that the picture has started changing. Spending statistics from the last period revealed that there is no visible difference in the consumption dynamics. On the contrary, the spending of all income categories is still growing, with none of the groups decreasing their spending. There is even an opinion among some officials that the gap between high- and low-income groups has started closing. Even if the structural divide, which concerns asset ownership and dependence on wages, has not disappeared yet. Spending dynamics reveal a different picture.
What Happens After a K-Shaped Economy?
However, the solution to the K-shaped divide theoretically can take a few paths. There might be convergence, where wages increase and there are more job openings. Lower-income families have easier access to affordable credit and property ownership. As a result of some existing trends, the divide can be maintained or even intensified. Such as automation and growing disparity in the skills and needs of the labor market. Economists warn that new forces at play might make the divide even bigger because of the spread of artificial intelligence throughout whole industries. Jobs that used to give people an opportunity to climb the social ladder might be lost due to the spread of AI technology.
It should be mentioned that no one can tell for sure what will happen to the divide. What we know for sure is that the divide may last for years instead of months, which makes it important when considering personal financial strategies.
E-Shaped Economy: A Related Term Worth Knowing
One may also encounter the phrase “E-shaped economy.” It deserves a passing mention because it is based on the same logic. A K-shape implies two separate branches moving in different directions; an E-shape includes a third one. Dividing the whole society into three groups instead of two, usually by separating the middle class from both ends. Instead of grouping all those who are not at the very top. The E-shaped economy is mentioned far less often than its K-shaped relative. However, both have one thing in common – the desire to highlight that one statistic does not always reflect everyone’s experience.
Why This Matters for Your Own Savings
Now comes the part that directly impacts your personal bottom line. No matter which arm of the K shape you currently fall on, there are actionable ways forward for you.
In case your financial position has been trending towards the upper arm – meaning that you possess assets like stock or property, and your income growth has been keeping pace with or beating inflation – the recommendations from financial experts are straightforward: keep up the good work, but don’t rest on your laurels. Keep investing steadily, diversify your investments across various asset classes and geographies, and be aware that the economy. It is inherently vulnerable as long as it is heavily skewed to one side. If the spending of the wealthier class slows down, the dependency of the economy on them being able to continue spending will have repercussions even on the currently comfortable households.
In case your finances have been trending towards the lower end – your wages have been lagging behind the cost of living, no investment exposure, increasing dependence on borrowing to pay for basic expenditures – the focus changes entirely. Putting aside some money into an emergency fund takes precedence above almost everything at the moment; even a few hundred dollars at a time until you build up your savings to a whole month’s worth of expenses is crucial now. Keeping your credit card balances low compared to your limit is important for your credit score; access to credit itself becomes a privilege of the wealthy in such an economy. Even small contributions to a retirement fund, just enough to benefit from any matching by an employer, if possible, will help accumulate the necessary ownership of assets.
If you’re looking for AI tools to earn money or the best side hustles, check out our other guides on those topics.